Analyzing Google Algorithm Updates With GSC and Rank Data
How to separate algorithm updates from other causes using search data.
A traffic drop by itself explains nothing. A site can lose a third of its organic visibility because a core update reweighted its quality signals, because a spam action caught one specific tactic, because Google Search Console miscounted impressions for eleven straight months, or because an AI Overview now sits above the result and swallows the click before anyone scrolls. Sorting out which of those four happened, and in what order, is the whole job. Skipping a step causes the fix to land on the wrong cause while the real problem keeps compounding underneath and the recovery window burns away.
The reference timeline: confirmed updates from 2025 through mid-2026
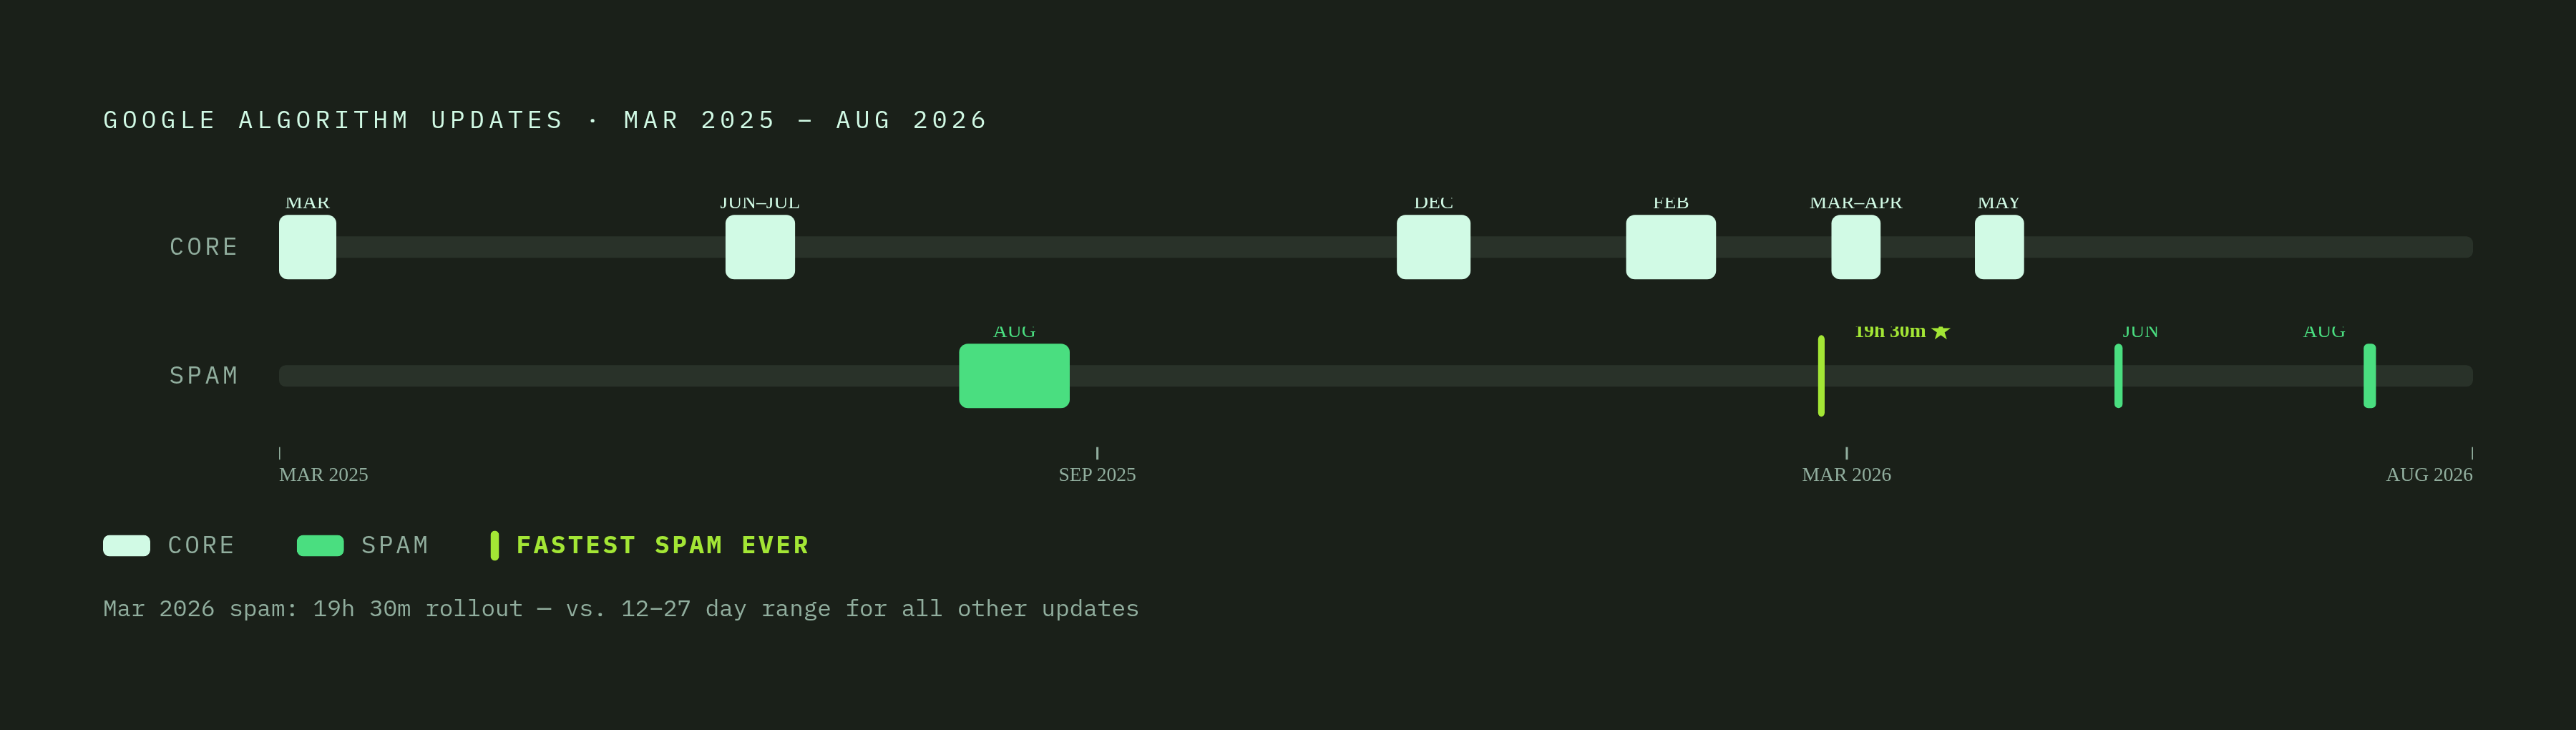
Nine confirmed updates ran between March 2025 and June 2026. Onset timing, not gut feeling, is what lets an analyst tell a core update hit apart from a spam action, so the dates fix the exact window an analyst checks against those nine confirmed updates from March 2025 to June 2026.
March 2025's core update ran March 13 to March 27, almost 14 days. June 2025's core update ran June 30 through July 17, about 17 days. Then came the August 2025 spam update, a long one at nearly 27 days, running August 26 to September 22. December 2025 brought another core update, 18 days, December 11 to 29, with two intensity spikes around December 13 and December 20 for anyone trying to pin an exact drop date. A one-feed-only core update in February 2026 was limited to English-language US users, running February 5 to 27, aimed at cutting clickbait and surfacing original, timely, locally relevant content.
Then things sped up. The March 2026 spam update rolled out in under a day, 19 hours and 30 minutes, the fastest confirmed spam rollout on record. Two days later, on March 27, a core update began that ran until April 8 and dropped 24% of top-10 results to position 100 or worse. Call it what it is: a brutal reshuffling. May 2026's core update ran just under 12 days and produced even heavier volatility than March, matching Google's own stated goal for it, which was surfacing relevant, satisfying content regardless of site type or size. June 2026 brought a fast, two-day spam update, and August 2026 closed the run out with another spam update spanning three days.
Rollout length swings wildly. Core updates average around two weeks, but spam updates run anywhere from under a day to nearly a month, and the longest rollout on record still stands at 45 days, from the March 2024 core update. The pace is speeding up too: 2025 produced four confirmed updates across twelve months, and the first half of 2026 alone produced five, a shift that changes how often this whole diagnostic has to run, full stop. That's not a minor uptick. It changes how often this whole diagnostic has to run, full stop.
January 2026 saw a string of high-intensity ranking swings, on the 6th, 12th, 15th, 21st, 26th-27th, and 29th, with no update announcement attached to any of them. That pattern lines up with Google's AI Overviews and AI Mode expansion rather than a named algorithm change, and it gets misdiagnosed as a silent core update more often than it should.
Step 1: Confirm whether an algorithm update is the cause
Before pinning any traffic change on an algorithm, check the Google Search Status Dashboard for the official start and end dates of the update in question. The anomaly has to fall inside that confirmed window. If a drop started ten days before the update even rolled out, the update didn't cause it, no matter how convenient that explanation feels.
The dashboard also logs indexing and serving incidents, and those produce traffic graphs that look nearly identical to an algorithm hit. A serving bug and a genuine core update demotion can both produce a sudden cliff in impressions, so ruling out an infrastructure incident comes first, ahead of anything else on this list.
A handful of ordinary, non-algorithmic causes need ruling out next: a recent site migration, a robots.txt change that accidentally blocked a section, server downtime during a crawl window, an internal link restructuring, or a plain seasonal demand shift. Each leaves its own signature in the data, and none of them call for touching E-E-A-T or content quality to fix.
Volatility tools work as a second opinion here. Semrush Sensor scores volatility from 0 to 10 by category and device, and a high reading signals real industry-wide movement rather than one site's isolated problem; Sensor hit 9.5 during the back-to-back updates spanning that same two-month stretch. MozCast tracks daily keyword movement with its weather metaphor, and it reads better as a directional gut check than a precise measurement. If either tool shows broad movement lining up with a site's own dip, an algorithm cause gets a lot more plausible. If the SERPs look calm while one site's numbers cratered, the cause sits inside that site, not inside the search engine's systems.
Step 2: Setting the right GSC comparison window
Compare the 28 days before an update's start date against the 28 days after its confirmed completion date. That window cancels out weekday-to-weekend swings while still leaving enough data to mean something. Use GSC's built-in date comparison tool directly, and don't let a comparison period cut through the middle of an active rollout. Rankings move all through a multi-week update, so a window straddling day 6 of a 15-day rollout ends up comparing two half-baked states against each other.
A serious complication sits in the middle of this whole stretch, though. A logging error caused Search Console to misreport impressions from May 13, 2025 through April 27, 2026, before Google fixed it. Clicks were never touched, only impressions and whatever gets derived from them: CTR, average position. The bug inflated impressions, and the fix corrected the number downward. Every CTR figure reported during that window understated the true rate, since clicks divided by an inflated impression count always comes out lower than reality actually was. Google hasn't backfilled the historical data, so that distortion is now a permanent feature of every account's history for that stretch.
The fix for this is to build three separate comparison windows inside GSC Compare instead of relying on one clean before-and-after. Set a pre-bug window from January through April 2025, a during-bug window running June 2025 through March 2026, and a post-fix window starting May 2026. Watch for a spike in impressions during the middle window while clicks stay roughly flat. Wherever that gap is widest is where the CTR reporting took the worst damage, and that's the range to treat with the most suspicion.
Step 3: Reading GSC Performance data in the right order
Read impressions first, then average position, then clicks and CTR. Not the reverse. The pull is to check clicks first, since that's the number tied to revenue, but reading clicks before impressions gets the diagnosis backwards more often than it gets it right, and that single ordering mistake is behind a lot of bad recovery plans.
A drop in impressions means the page lost visibility for those queries, pointing toward a ranking or indexing change rather than a click-behavior shift. A drop in clicks while impressions hold steady points somewhere else entirely: a SERP feature stealing the click, an AI Overview or featured snippet sitting above the result, rather than any ranking loss. Those two patterns call for completely different responses, and mixing them up is one of the most common mistakes in this entire process.
Average position needs its own caveat. GSC reports it as an aggregate across device, country, result type, and query variant, so it belongs to trend-line reading rather than precise measurement. A strong head term can single-handedly mask real deterioration across dozens of secondary queries: one query climbing a few spots offsets twenty others sliding, and the blended average looks fine only because it's built by averaging over the decline.
From there, drill down by segment: query, page, device, country, and search type each reveal different layers of the problem. Starting with page before query is a common shortcut that backfires, because it risks mistaking a URL-level technical problem (a broken canonical tag, a slow-loading template) for a ranking shift that had nothing to do with that page's content.
Step 4: Distinguishing a core update hit from a spam penalty
This distinction decides what gets fixed, and getting it wrong wastes the whole recovery effort. Spam enforcement targets specific policy violations: link schemes, scaled low-quality content, cloaking, keyword stuffing, and removing the violation can bring recovery. A core update reflects a broader quality reassessment, and no single tactic caused it, so no single tactic removes it either.
The onset date is the tool for telling the two apart. A drop that started on a spam update's rollout date points to a policy violation somewhere on the site. A drop that started when a core update began points to a reassessment of quality signals: E-E-A-T, overall helpfulness, topical depth. The March 2026 stretch is the clearest recent example. The spam update ran March 24 to 25, and the core update started March 27. A drop beginning March 24 tells a completely different story than one beginning March 27, even with the two dates sitting just three days apart on the calendar.
Spam-related drops tend to hit specific page types hard: doorway pages, thin affiliate content, pages built around exact-match anchor text. The drop is often sudden and steep, and recovery, once the violation gets fixed, can come fairly fast. Core update drops look nothing alike. They spread broader, hitting multiple page types and query clusters at once, with no single lever to pull, since the factors involved, author credibility, content depth, don't come off in one removable action.
Step 5: Isolating affected query clusters and page types
Filter by query type first. Informational, transactional, and navigational queries rarely take the same hit from the same update, and whichever cluster got hit tells you which quality signal Google re-weighted. A site that lost visibility only on informational queries is facing a different problem than one that lost its transactional rankings, and treating them as the same fight wastes time.
Filter by page type next: blog and editorial content against product and category pages against the homepage. A core update that tanks blog content while leaving product pages untouched is flagging a content-quality issue on specific pages, not a site-wide authority collapse, and that distinction determines where the remediation work actually goes.
Look for the pattern across a cluster rather than chasing the fate of individual URLs. Five demoted pages scattered across a site reads closer to coincidence than diagnosis. Every page inside the /blog/ directory that happens to lack an author byline getting demoted together, though, that's a diagnosis, and it points straight at a fixable structural gap.
Rank tracking tools complement GSC here rather than replace it. GSC gives an aggregate position across every query variant a page ranks for; a rank tracker gives the exact position for one specific keyword at one specific point in time. Third-party platforms like Semrush and Ahrefs also show something GSC doesn't display at all, which is which queries now trigger an AI Overview above the organic results, often the missing variable in a drop that otherwise looks like nothing changed.
AI Overviews' distortion of the traffic picture and the need for a separate diagnostic layer
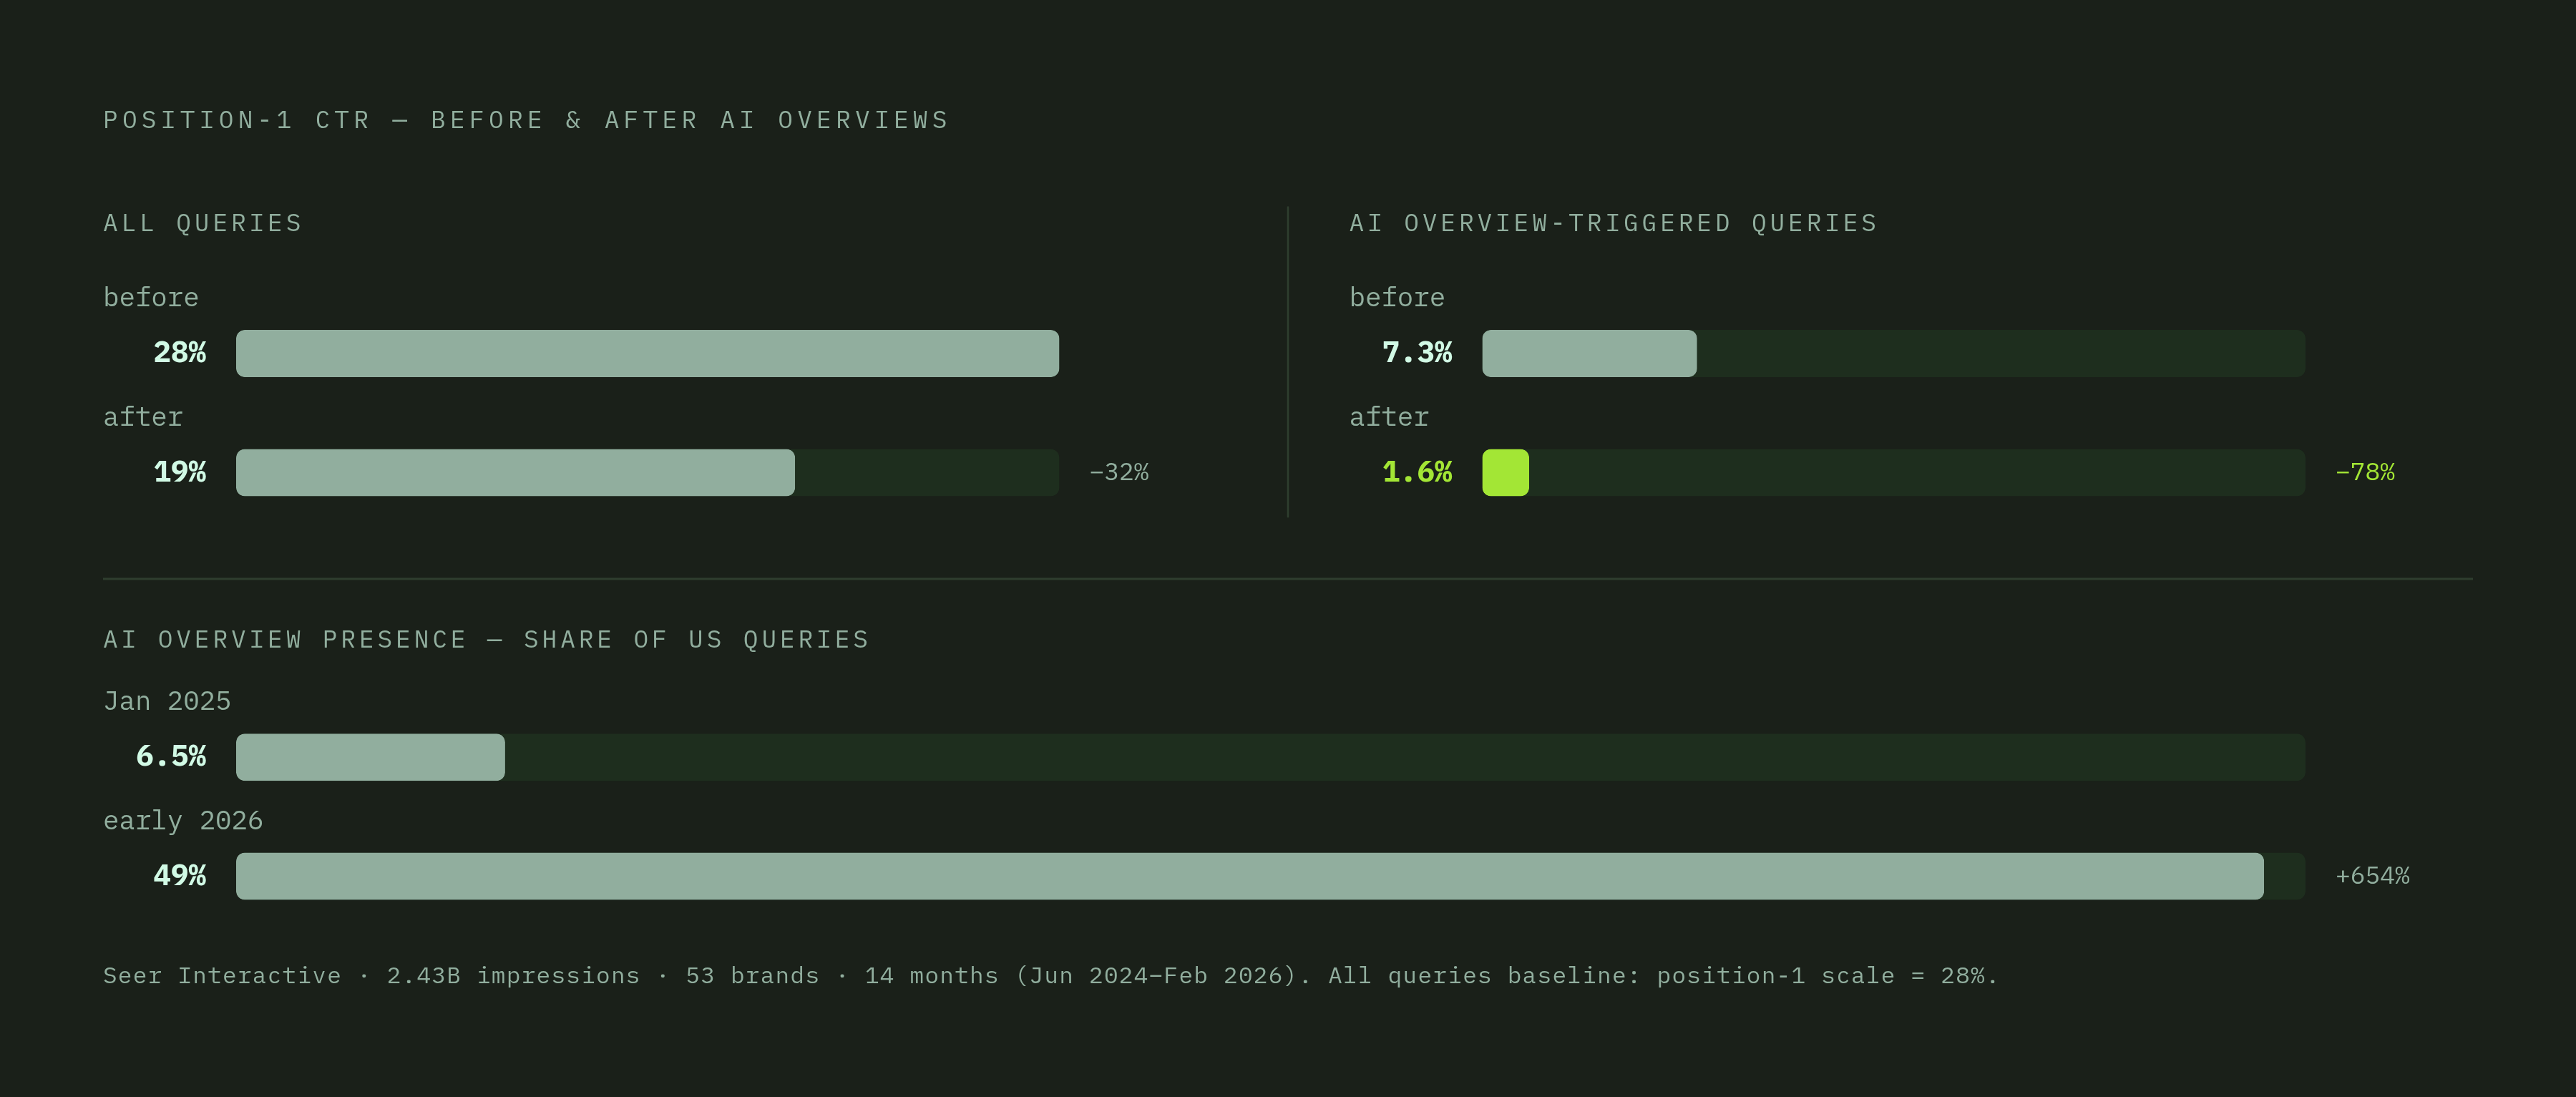
AI Overviews now appear on roughly 48 to 50% of all US Google Search queries as of early 2026, up from about 6.49% in January 2025, close to an eightfold expansion in a little over a year. That shift alone is large enough to explain a huge share of the traffic changes analysts keep chasing under the "algorithm update" label, and it earns its own diagnostic pass, separate from everything above.
The CTR data backs this up from more than one direction. Data reported by seomator.com found position #1 organic CTR fell from 28% to 19% year over year, a 32% decline, tracking closely with AI Overview expansion. Separate data found something sharper on queries where an AI Overview actually triggers: position 1 CTR collapsed from 7.3% to 1.6%. Research also found that AI Overview presence correlates with a 58% lower average CTR for whatever page ranks first, regardless of that page's actual quality.
Seer Interactive ran the longest study of the group, covering 2.43 billion impressions and 5.47 million queries across 53 brands over 14 months, and found organic CTR on AI Overview-triggered queries fell from 1.76% to 0.61% between June 2024 and September 2025, a 65% collapse, before rebounding to 2.4% by February 2026. That rebound might reflect users adapting to the new layout, or it might reflect Google adjusting how it cites sources inside the Overview itself, and each explanation points to a different response. Some 2026 datasets put the share of zero-click informational queries as high as the 60-to-83% range.
For a large share of search traffic, the ceiling on organic clicks was lowered before any core update ever touched the rankings. A site chasing a ranking fix for what is actually an SERP-feature displacement problem is solving the wrong equation, and it will keep solving the wrong equation until someone checks whether the query still sends a click past the Overview box. No amount of E-E-A-T work brings that click back if the query never intended to send it that far to begin with.